Performance indicators in a classification model

You have probably come across terms such as error rate, confusion matrix, precision, recall and the acronym AUC ROC. All these terms measure in one way or another the performance of a model, in short, how well it performs its classification function.
In this post, I want to explain for everyone, and for my future self in 3 months, when I want to review these terms again, what each one means, how it is calculated, when we should use each one and how the terms themselves are interrelated.
We all know about covid, and therefore we all know about the existence of antigen tests. Those plastic boxes that told you whether or not you had covid. Believe it or not, it is tremendously similar to what we mean by a classification model in terms of artificial intelligence. Weird, I know, but think about it!
The test receives an input (a sample of your nasal flows) and provides an output (covid or not). Let's treat this covid test for all effects as a classification model.
Usually this test doesn't fail, if you have covid it tells you so and if you don't it shows you so too. However, in this classification task no model is perfect, and there will be times when you have covid and it tells you that you don't, just as there will be times when you don't have covid and the test tells you that you do.
It is therefore very important to introduce the following concepts:
- TP (True positive): The model indicates that you have covid and the reality is that you do.
- TN (True negative): The model indicates that you do not have covid and the reality is that you do not have it
- FP (False positive): The model indicates that you have covid but the reality is that you do not.
- FN (False negative): The model indicates that you do not have covid but the reality is that you do.
It is very important to have these concepts clear, as they will be key to understand the rest of the article.
Error rate
The error rate represents the ratio between the errors in the classification (FP and FN) among all the data that have been classified. In short, in overall percentage, how much the model is wrong.
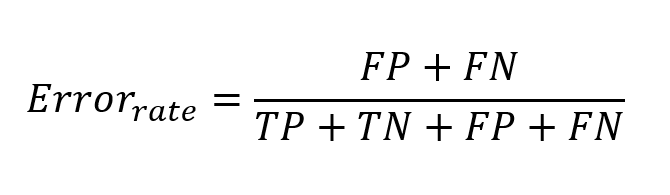
This indicator helps us to know how much the model is mistaken in general. Obviously, the model may be worse at detecting one class or another, however, this indicator is only useful to get a general idea of how good it is.
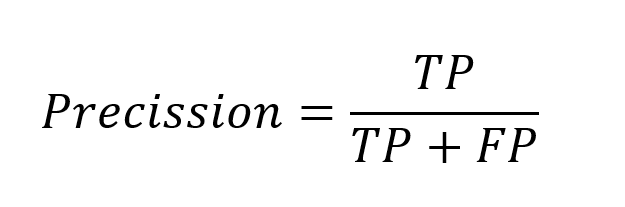
Precision and Recall
To explain this concept, it is important to ask a question. Which is more harmful, telling a person who does NOT have covid that they DO have it, or the other way around, telling a person who suffers from the disease that they do not have it.
It is clear that the latter is worse. This is why the concepts of precision and recall exist. Accuracy and recall are almost complementary concepts, the more accuracy, the less recall and vice versa. That's great Pablo! But what are they?
Unlike error rate, precision and recall apply to each class, that is, we will have precision and recall for positives and negatives.
Precision is exactly what the name implies, how accurately we get it right when we classify a type. That is, of all the people the model says are positive, how many are actually positive.
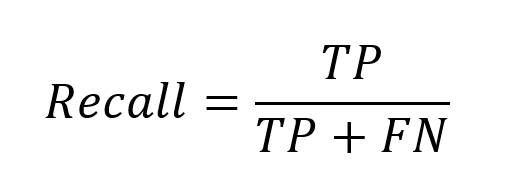
Recall, on the other hand, is the other side of the coin and answers the question of how many of all the positive people in the sample I am able to detect effectively.
If I concentrate on building a model that when it stipulates that someone is negative, it is NEVER wrong, I will have a model with excellent accuracy, but it will error on the side of failing to classify as negative many people who may be positive. Conversely, if all the people in the sample are positive as positive, the model will have incredible recall and we will ensure that all positives are classified as such, but we will be erring on the other hand, classifying as positive many people who are not.
To create an efficient model, the relationship between the two variables must be taken into account.
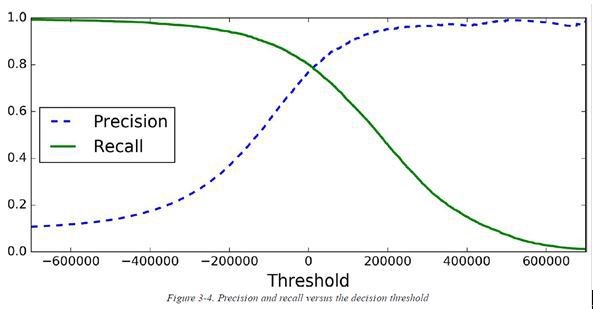
There is a point at which a good relationship between the two can be achieved. However, it is very important to attend to the particular problem at hand.
In the case of covid, it is better to have a higher recall, to detect all people who have covid, because it is better to have a False Positive than a False Negative.
Let's imagine that, in a population, 1000 people take the covid test. After obtaining their results, they are tested again, this time using a blood test (more reliable test) to check if the test result is correct. After comparing the results, we obtain what we call a "Confusion Matrix"
CONFUSION MATRIX
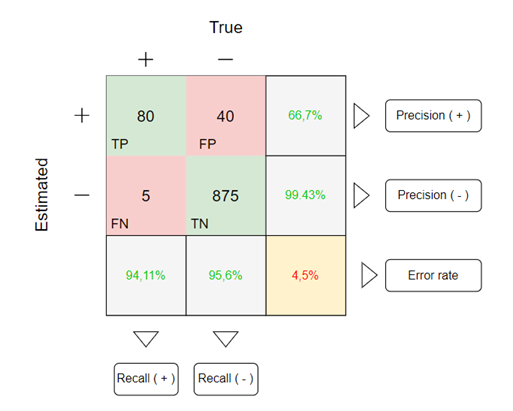
The confusion matrix shows in a very visual way the amount of TP, TN, FP and FN that have occurred in the classification task. It is also used to be able to see in a simple and clear way the precision and recall value of both, positives and negatives.
It is for this reason that when data scientists want to evaluate the performance of a classification model, they think of the confusion matrix. However, this is not the only thing they use, they also keep an eye on the AUC ROC curve.
ROC curve
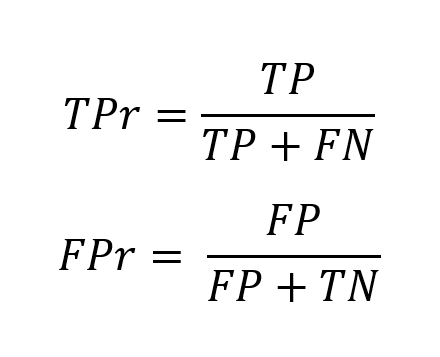
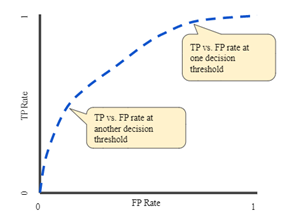
An ROC curve (receiver operating characteristic curve) is a graph that shows the performance of a classification model at all classification thresholds. This curve plots two parameters:
- True Positive Rate
- False Positive Rate
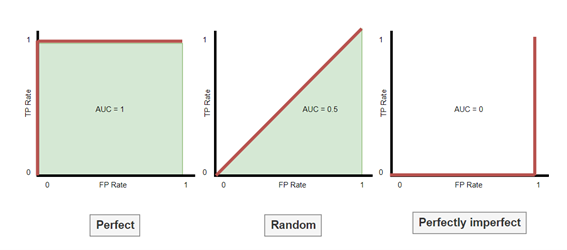
AUC: Area under the curve
It's the Area under the ROC curve. Since the value of this curve goes from 0 to 1 on both axes, the maximum area under the curve is 1 and the minimum is 0.
- AUC = 1 means all the positives are true positives and all the negatives are True negatives
- AUC = 0.5 it's the worse situation possible. This is a classifier that can't distingyust between positives and negatives at all.
- AUC = 0 mean all the positives are true negatives and all the negatives are True positives ( so, we have a perfect imperfect classifier)
Conclusion
When I first learned the theory of classification models, I only learned the error rate. However, you quickly realise that you need other metrics to evaluate the performance of a model in detail, so that you can calibrate it and know where there are areas for improvement.