Second hand car price predictor

Project overview
Let's say you recently received your driver's license. Congratulations! You now have everything you need to begin driving. The car is the second and trickiest ingredient.
If you don't already have one, you can choose between buying a brand-new car or a used car. Since this is your first car, it will be the one in which you learn to drive properly, so you aren't going to treat it with the utmost care.
Since this is going to be your first car, you decide to buy a second-hand car. It' s a cheaper and better option for your case.
Problem introduction
You start looking into second-hand marketplaces and rapidly discover that there are lots of different prices for the same car. This is due to the mileage of the car, the year, the brand...
The prices of different cars vary greatly; even identical car models may have different prices. This is because all the cars are different, with different characteristics. For example, for the same car model, a car with fewer miles is usually more expensive. But the mileage is not the only feature. A car's price depends on a lot of features. This is a problem because you are not a car expert and have no idea which of these features will affect the price more or less. So the question is, what is a reasonable price for a car based on its characteristics? The person looking for a car might not be a car enthusiast, but he wants to know what the fair price of the car he wants to purchase is.
Problem solve:
This is where this project becomes valuable. I have trained a model that estimates the price of a car based on certain features. This way, anyone can fill out the features of the car and get a fair price for the model. This way, you can compare the price of the car in the marketplace with the price the model estimates is fair.
Strategy to solve the problem
To solve the problem, I need to train a model, but to do this, I need to follow some steps.
Firstly, I need to get data to train the model. In this case, I need a dataset with information about second-hand cars' features and their price.
Secondly, I will clean the dataset, since it might come with some null or nonsense values.
Thirsly, since the dataset will contain some cool insights, I will ask myself some questions and answer them using the dataset information.
Last but not least, the model. With all these steps done, I will be prepared to train a model, but, what type of model? what hyperparameters? how
I'm going to evaluate it's performance?
Reader, the answer to all these questions and all the steps taken before modeling the data are explain above!
1.- Data preprocessing
Firstly, I needed data about cars in the second-hand marketplace. I used this Kaggle dataset, which has 100K listings of cars in the UK:KAGGLE SET
The data sets are separated into different car brands. Since I wanted to develop a model that predicted the price for every brand, I merged all the datasets together, adding a new column called: CAR_BRAND.
Next, I searched for missing values. This dataset doesn't have missing values, so I didn't need to impute any. Then, I searched for no sense values, like, for example, a car manufactured before 2022.
Lastly, and when I had a clean dataset to work with, I saved it into a csv file.
2.-Data exploration
This dataset contains information about cars. Each one is described by some features. These are:
- Price: In pounds
- Transmission: The vehicle's transmission type.
- Mileage: Indicate the distance used in miles.
- MPG: Stands for miles per gallon of fuel.
- EngineSize: engine size in litres
- tax: The Car Road Tax is the vehicle's road tax. Since all the cars listed here are from the UK, the tax is the UK tax
Since I have all this data, I wanted to ask and answer myself a few questions.
- Do some brands use more fuel than others?
- Does the price of a car depend on the brand?
- What are the top 10 most sold cars and what is their mean price?
- Does the price depend on the year?
- Do new cars use less fuel than old cars?
Q1: Do some brands use more fuel than others?
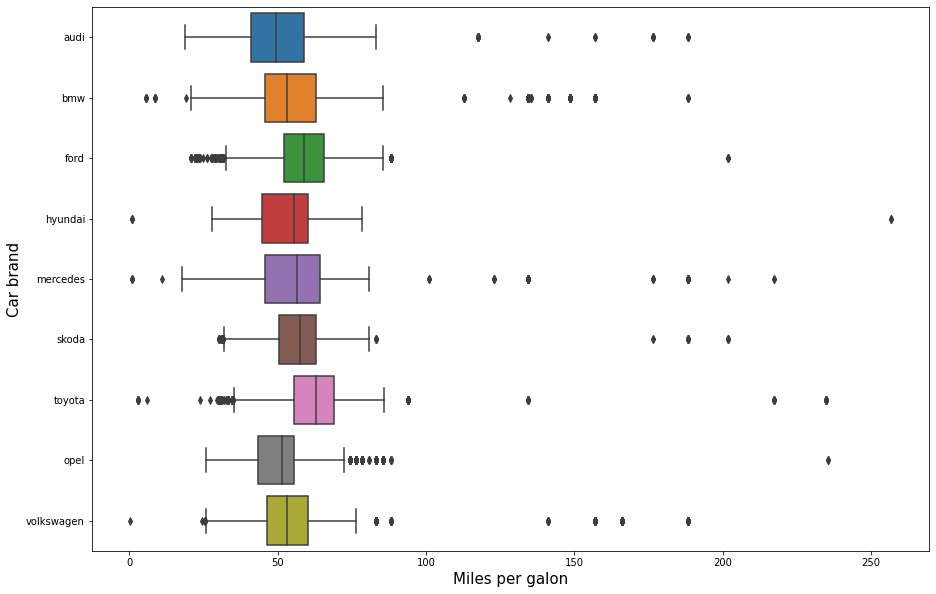
The answer to this question has to be no. This is because almost all the data from every brand is located around the same range. It's true that some brands have more outliers than others. For example, Audi, BMW, and Mercedes have lots of outliers. This is because these brands are high-class, which means they also manufacture some super car models with superior performance, which leads to a higher consumption.
Q2: Does the price of a car depend on the brand?
Before we base our answer on any plot, we have to tend to think that the answer to this question is yes. This is because different brands are designed for different clients. For example, Mercedes, Audi, and BMW are designed to reach a more wealthy market that can afford expensive cars. On the other hand, other brands like Opel, and Hyundai try to reach a more average market.
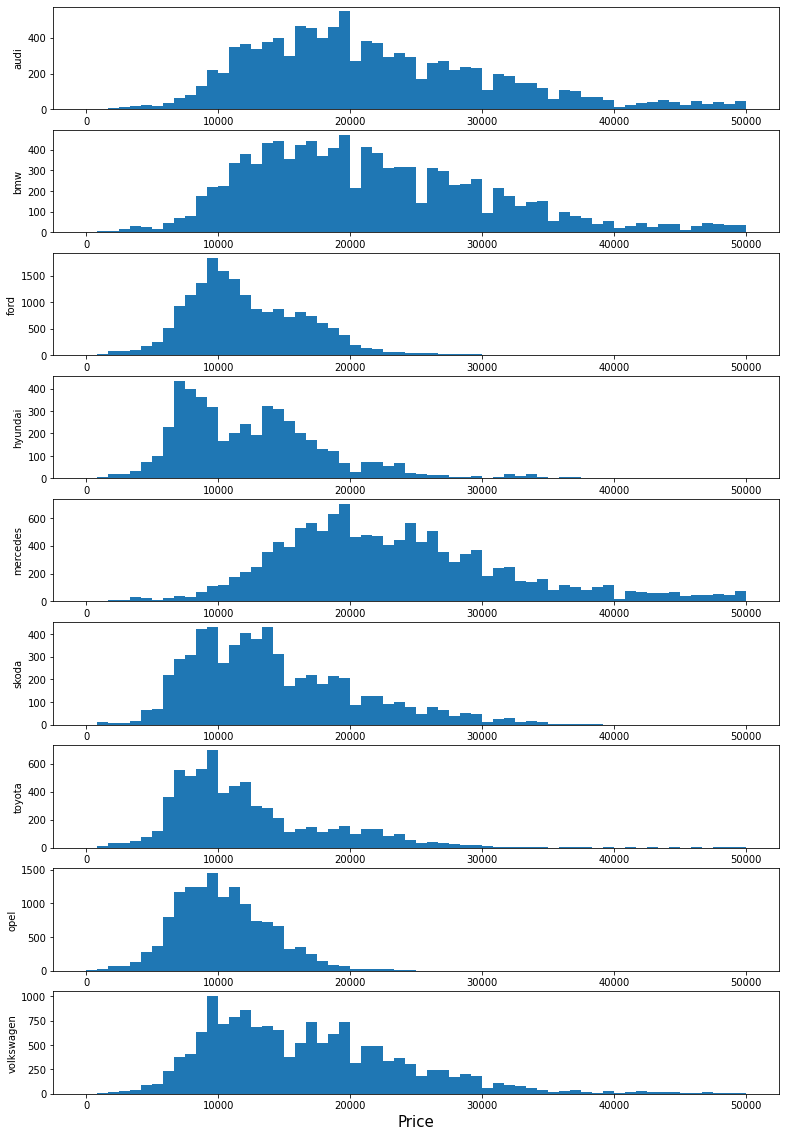
The answer to this question is clearly no. Brands like Toyota, Opel, Hyundai, and Ford have almost all their car models in a certain price range lower than Mercedes, BMW, and Audi.
There are two brands that seem to offer both. These are Skoda and Volkswagen. They have the widest range of prices of all of them. This means that they offer cars for the middle class, but they also offer some high-quality cars too.
Q3: What are the top 10 most sold cars and what is their mean price?
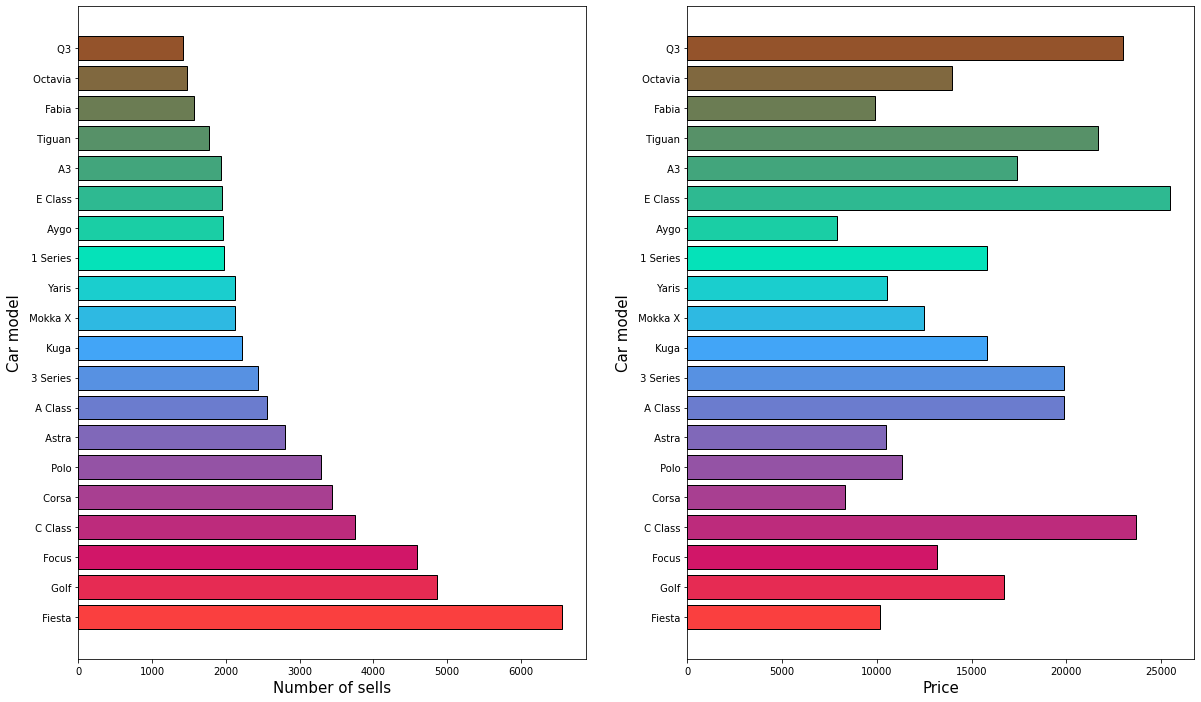
These are the top-most sold cars in the UK's second market place. On the right hand side of the plot, we can see the prices of each car, while on the left hand side, we can see the model of the car. A cheaper car doesn't mean a best-seller car.
Q4: Does the price depend on the year?
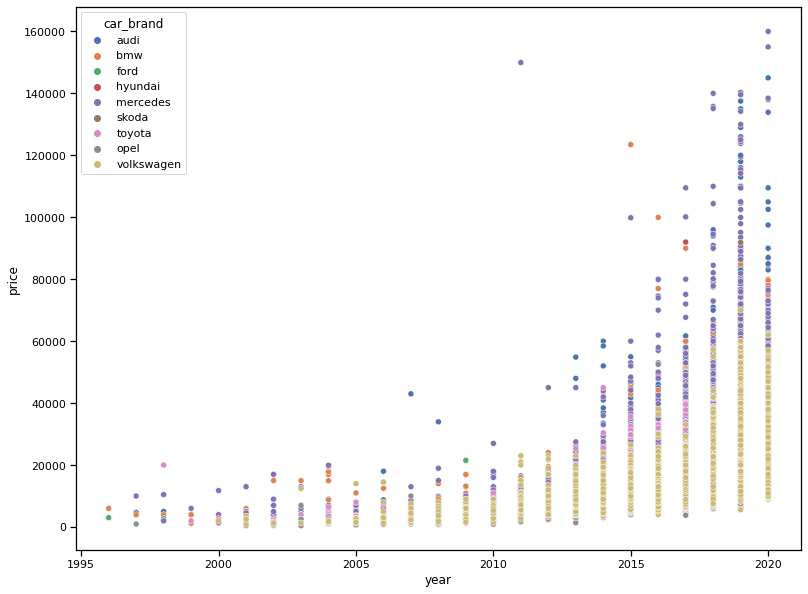
We can clearly see that the price depends on the year of the car. This makes sense because the older the car, the less you are going to pay for it. There is an interesting observation about this plot. The price of the car will decrease a lot in the first 5-7 years. Then, it becomes more stable. This is what happens in the real world.
Q5: Do new cars use less fuel than old cars?
The world is becoming more and more eco-friendly each day, and this leads to fewer emissions in cars. The more mpg a car gets, the more emissions it produces.
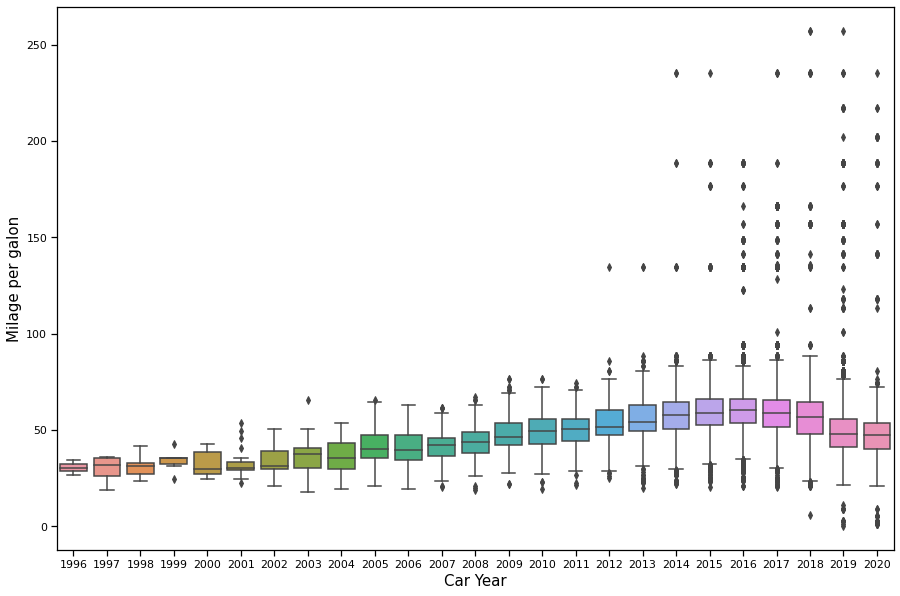
We can clearly see that the miles per gallon that cars use has increased over the years, but, with the exception of the last few years, we can clearly observe a decrease. This is because the world is becoming more and more eco-friendly each year.
3.- Data modelling
A car's price is dependent on various features. For example, the higher the mileage of the car, the lower the price, as well as the bigger the engine size of the car, the higher the price. This is because higher engine sizes are related to more luxury cars. With all these features combined, I'm going to do my best to find a model that is able to predict the price of a car based on its features:
To fit the best possible model, I'm going to follow the following steps. I will train three different regression models. Then, I will choose the best. But, how do I choose certain model over another? I will based my decission in a metric.
Metrics for regression models
In this section, I will take a look at the popular metrics for regression models. These are:
- Mean Squared Error (MSE)
- Root Mean Squared Error (RMSE)
- Mean Absolute Error (MAE)
The Mean Squared Error(MSE) is calculated as the mean or average of the squared differences between predicted and expected target values in a dataset. Large errors are also inflated or magnified as a result of the squaring. In other words, the larger the discrepancy between the expected and predicted values, the larger the squared positive error that results. As a result, models are "punished" more for larger errors. The units of the MSE are squared units, this makes a little bit difficult to intepretate this metric.
The Root Mean Squared Error (RMSE), is an extension of the mean squared error. The square root of the error is calculated, which means that the units of the RMSE are the same as the original units of the target value that is being predicted.
Mean Absolute Error (MAE), is a popular metric because, like RMSE, the units of the error score match the units of the target value that is being predicted, but in this case the changes in the error are linear.
In this case, I have chosen to use the MAE metric. This is because, when evaluating the model, I want to know how much error, in pounds, the model usually makes. So, for example, imagine my model has a MAE of 3000 pounds. This is, when estimating the prices of cars, you can expect an average of 3000 pounds of error. Sometimes the error will be 2000, sometimes it will be 4,000, but the average of the errors will be 3000 pounds in the long run.
types of models and previous explanation
I will train and compare 3 different regression models. These are, 'Linear regression','K neigbors regressor' and 'decission tree' regressor. Each of these models has it's own hyperparameters that needs to be tuned.
One of the features, 'car_model' has 196 unique values. This feature is categorical which means that needs to be dummify which means 196 new columns to our dataset. Since using this feature will increase a lot the level of complexity of the model, I need to make sure that training a more complex model is worth it.
1.- Fit a linear regression model using all features except "car_model"
The first thing we have to take into a consideration is: What hyperparameters are we going to change in orther to get the best performance?
The answer to that question in this case is 'Polynomial degree'. I'm going to try degrees = [1,2,3,4]. If degree 4 results in worse performance than three,
I know that a polynomial degree of three is optimal.
I will use Gridsearch for this task.
After applying Gridsearch, the optimal hyperparameter is degree = 3. This gives this model a MAE of 2014.966 pounds.
2.- What if we use the feature 'car model'
Since polynomial degrees higher than 1 result on an error, this hyperparameter has 0 degrees of freedom. This is a computationally difficult task for the computer, but after a while, we can see the result.
Using the feature 'car_model' along with the rest of the features leads to a MAE of 2276.2754. This is, lower performance than the previous model with a way higher level of difficulty. Since this is not a fair trade, there is no way we are using this model.
3.- fit another model, KNeighbors Regressor
In this case, the hyperparameter that needs to be tuned is the numbers of neigbors the model uses to predict. I will use neigbors from 1 to 10 in order to select the best. If the best hyperparameter is 10, then I will try some more neigbors but if the hyperparameter is less than 10, then I know that neigbor number is the optimal.
After applying Gridsearch the model seems to have it's best performance with 9 neigbors. This give the regressor a MAE of 5148.66.
4.- fit another model, Decission tree Regressor
Last but not least, I will train a decission tree regressor model. THe hyperparameter I will tune for this model is the 'min_samples_split'. I will chose between using 2 or 3.
After applying Gridsearch, the model seems to present it's best performance with 3, this gives the model a MAE of 2156.50
Evaluation
Let's recap:
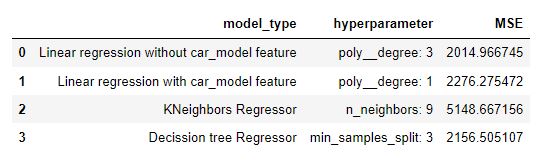
This table contains the information about the model type, model hyperparameter and MAE. After looking at it, we can make a decission. I will choose the model with the lower number of MAE, in this case, the linear regression model that doesn't count with 'car_model' feature.
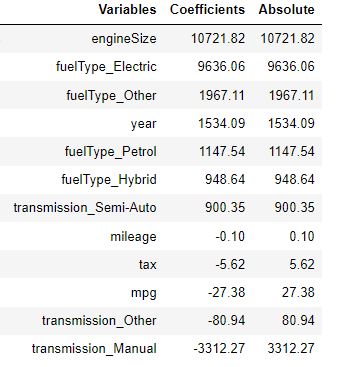
Since this is the model that the user will be using to make the predictions, lets see more about the model, for example, the feature importance:
Conclusion
Estimating the price of a car based on some features is possible A person looking to buy a second-hand car in the UK, will find this project deeply useful.
Problems: Since this dataset only contains a listing from the UK, it's possible that extrapolating this information to other parts of the world will result in a decrease in performance. This information has to be updated once in a while because there are factors, like inflation or the time of the year, that affect the price of the second hand market. For example, in summer, the price of motorcycles increases, as well as in winter, the price of cars.
Future work: It will be interesting to build a model that estimates the price of a car based on more features. Also, I would like to work on the client profile. These features also affect the price of the car. For example, younger drivers tend to treat cars worse. This will lead to a decrease in the price.
Link to the Github repository HERE